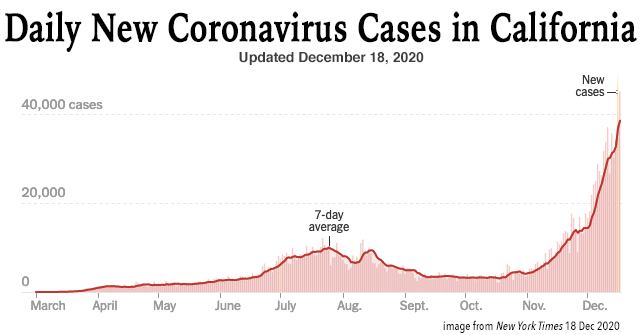
Coronavirus is getting worse in California, rapidly. Our new case rate has increased significantly. This graphic I adapted from The New York Times "Coronavirus in the U.S." (retrieved 18 Dec 2020) shows the steepness of the curve.

Most news articles I see focus on the raw number of new cases in California. While the raw number is a fact, it is really a factoid — a thing that can actually be counterproductive to understanding if not placed in proper context. The context most of us are looking for is "What's the rate?" The statistic epidemiologists have settled on is New Cases Per 100,000.
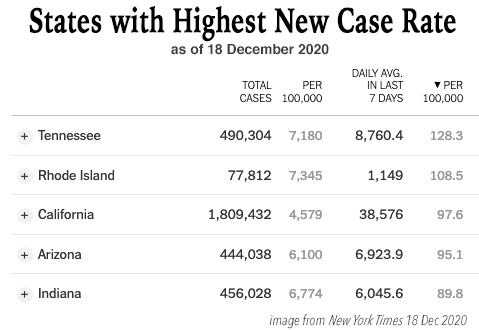
The 7-day average of new cases per 100k in California as of today is 97.6. This compares unfavorably with a national rate of about 65 as of today. In fact California is now the 3rd worst state in the US on this metric:

This is a big turnaround. As recently as two weeks ago California was well below the national average. A month ago we were in the healthiest quartile. Back in May our New Cases per 100k rate was just 6— compared to almost 98 today. Even at the peak of the summer surge in late July it was just 25.
Within my home area, Santa Clara County (pop. 2 million), the rate is better than the state as a whole though still quite high compared to before at 62 (NY Times, ibid). Other jurisdictions in the SF Bay Area are slightly better off. San Mateo, between us and San Francisco, is at 52. San Francisco city and county is at just 32.

Most news articles I see focus on the raw number of new cases in California. While the raw number is a fact, it is really a factoid — a thing that can actually be counterproductive to understanding if not placed in proper context. The context most of us are looking for is "What's the rate?" The statistic epidemiologists have settled on is New Cases Per 100,000.
The 7-day average of new cases per 100k in California as of today is 97.6. This compares unfavorably with a national rate of about 65 as of today. In fact California is now the 3rd worst state in the US on this metric:

This is a big turnaround. As recently as two weeks ago California was well below the national average. A month ago we were in the healthiest quartile. Back in May our New Cases per 100k rate was just 6— compared to almost 98 today. Even at the peak of the summer surge in late July it was just 25.
Within my home area, Santa Clara County (pop. 2 million), the rate is better than the state as a whole though still quite high compared to before at 62 (NY Times, ibid). Other jurisdictions in the SF Bay Area are slightly better off. San Mateo, between us and San Francisco, is at 52. San Francisco city and county is at just 32.